← Tim Vasil
Features
This is a personal hardware + software project, inspired by TheFlightWall ,
with the goal of pulling as much interesting live data from the internet as possible to showcase on a wide LED display over my living room fireplace.
It started with a simple question, “What’s that ship passing by in San Diego Bay? ,” but now answers all sorts of questions including “What’s the best time to walk the dog today?” and “What are the trending streaming shows?”
I built the display from seven 64 × 64 LED panels, driven by a Raspberry Pi. That gives me 448 × 64 pixels to work with, which is an interesting constraint (and aspect ratio) for 40+ apps!
Nonetheless, I was able to take advantage of a 30 fps frame rate (on a 100+ Hz panel refresh) with full 24-bit color to craft some pretty slick visuals and animations, including map imagery that zooms and pictures of baseball players during live games.
The intro splash screen as LumiBridge boots, with sound.
The Home screen alternates between app icons and a dashboard of live updates.
Let the apps take turns. Autoplay gives priority to timely updates, like an approaching trolley or a ship entering the bay. It resumes after the remote has been idle, so the display can mostly look after itself.Use a remote, browser or voice. The media remote handles everyday navigation. The web interface adds a live preview and configuration tools, while speech-to-speech AI lets me ask questions or tell the display what to show.See several apps at once. The Home screen switches between app icons and a dashboard of small live previews.Keep it comfortable in the living room. Brightness follows local sunrise and sunset, with separate day, twilight and night levels. Scheduled on and off times use gradual fades.Receive ship data directly. A software-defined radio and VHF antenna pick up AIS broadcasts from ships on the bay. Aircraft positions come from an online ADS-B feed.Make room for the next idea. Each app is a Python plugin with its own settings. Panel mapping is separate from the apps, and a simulated display lets me develop on a laptop without the hardware.
Photos
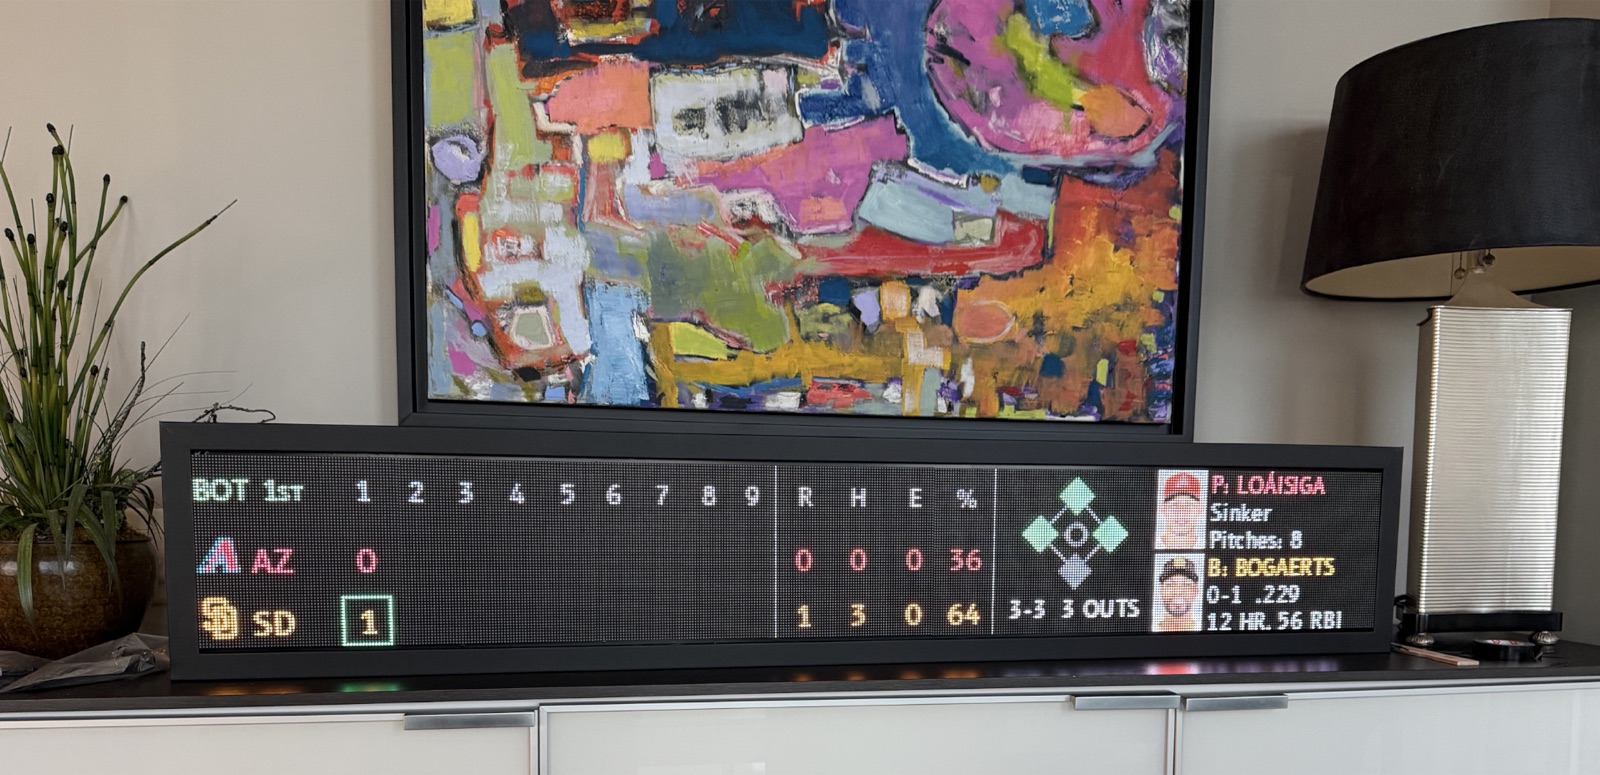
LumiBridge framed and ready for mounting, showing the play-by-play of a Padres game along with real-time prediction market odds of victory.
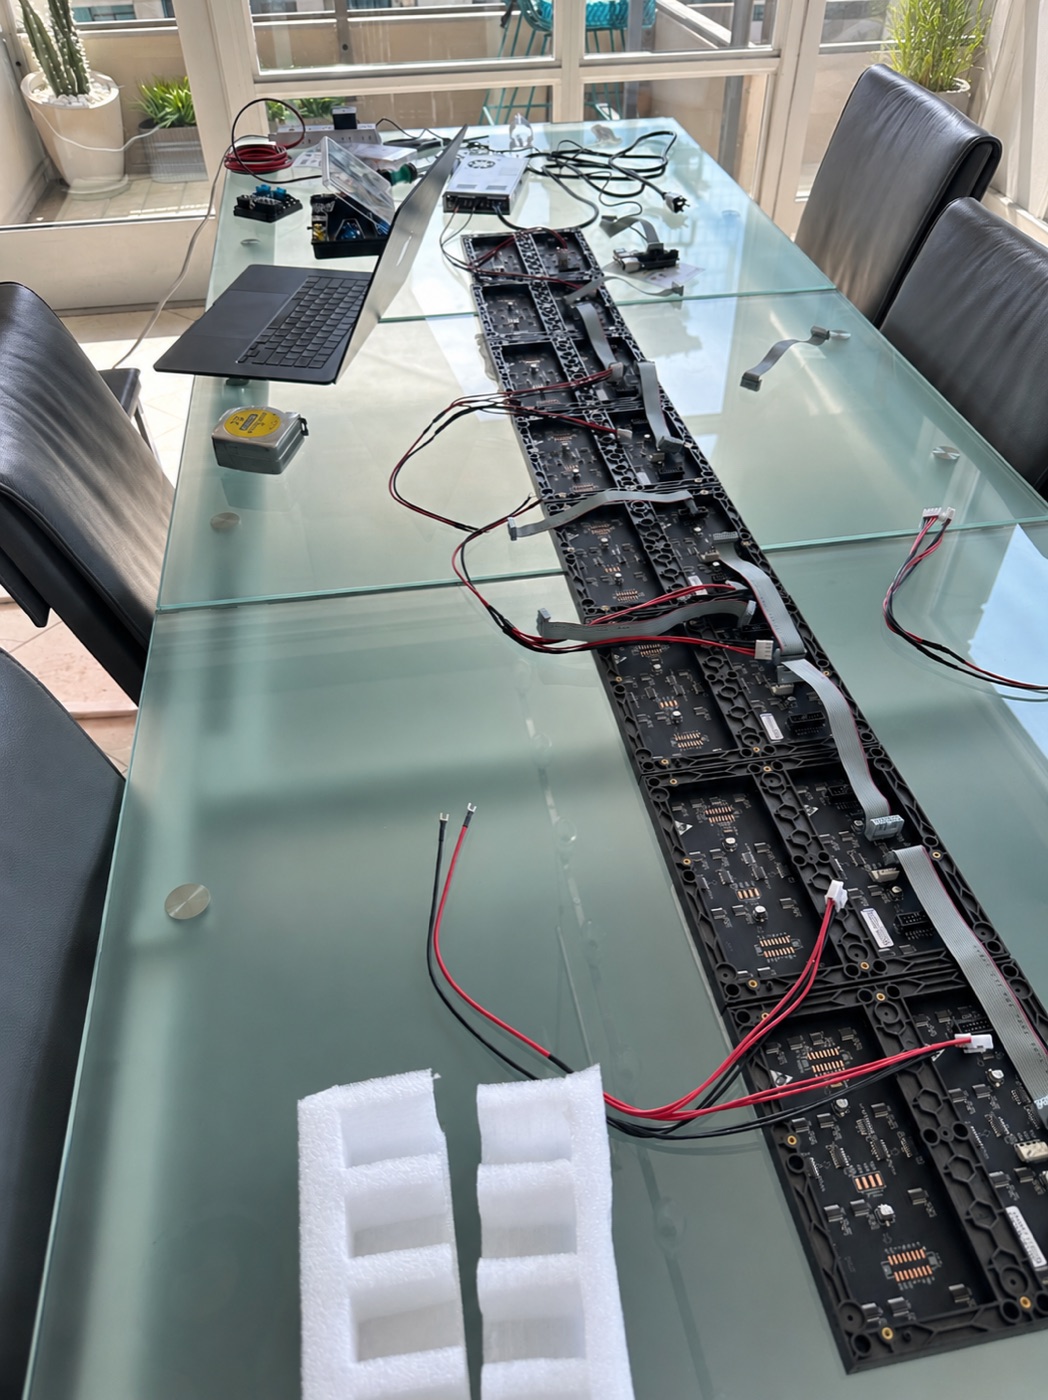
Early assembly on the dining table: daisy-chaining displays and contemplating power hookups.
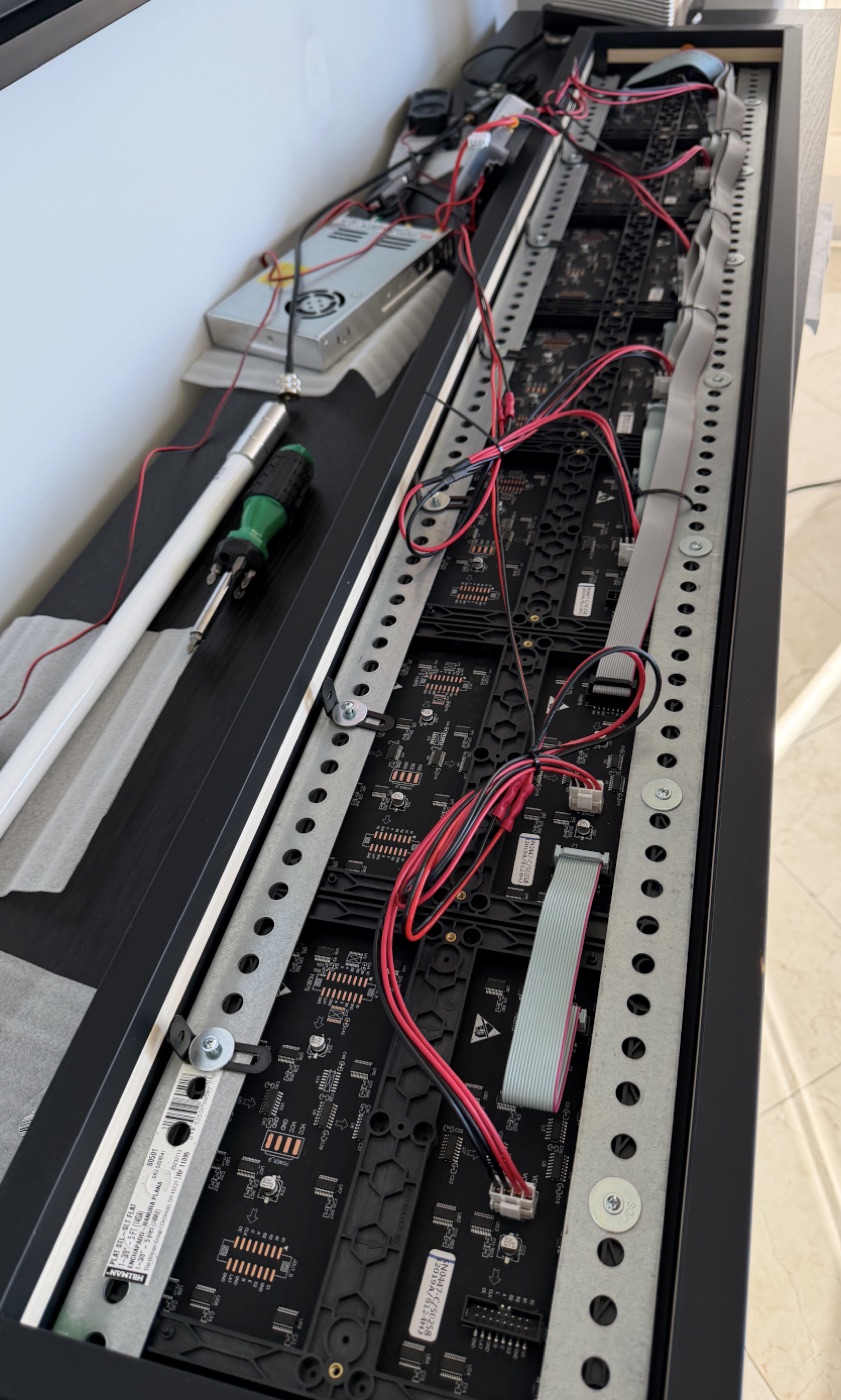
From behind, near the end of the build: panels secured to steel rails, and the rails secured to the frame.
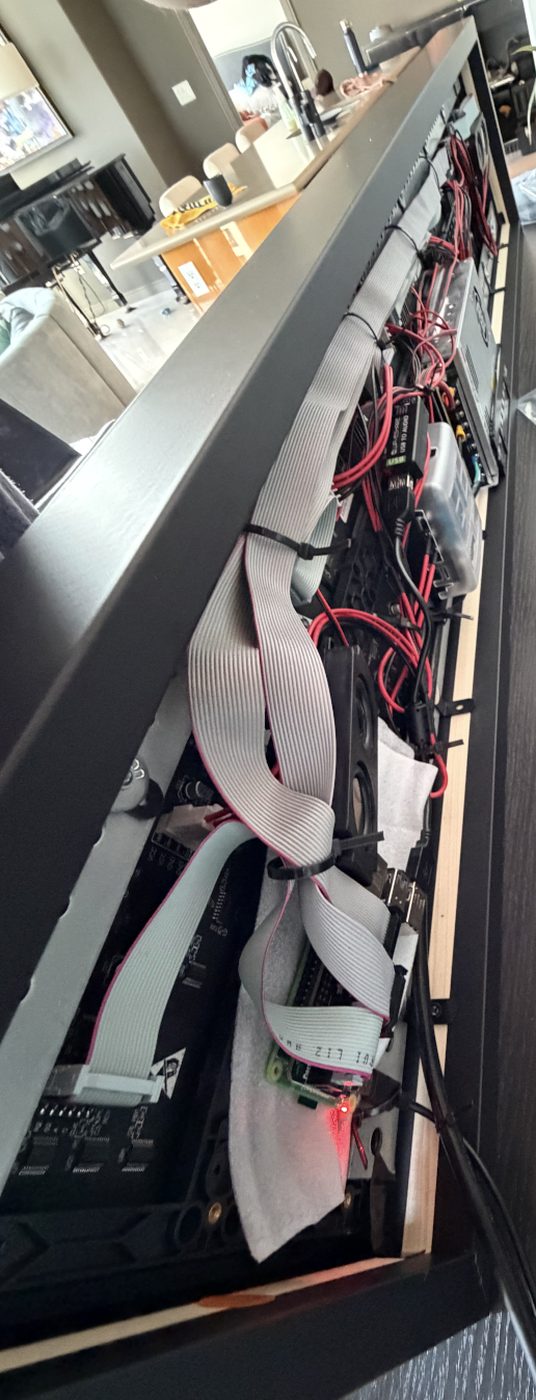
Lumi’s close up close to finished: all parts secured inside the frame.
Apps
Select an app for screenshots, capabilities, configurability, and data sources. Home and Autoplay come first; the rest are alphabetical. Use the arrow keys to browse between apps.
Home Autoplay Birds Books Cameras Cars Chats Clocks Commits Crafts Currents Drives ETAs Events Fires Flicks Forecasts Games Goals Locks News Odds Photos Polls Pumps Quakes Rates Scores Settings Stars Stats Stocks Takeoffs Temps Tests Tickets Timers Tunes Visitors Waves Wikis
No app matches that.
‹
›
×
Capabilities
Apps report a priority from 0 to 1. An approaching trolley or a ship entering the bay can take precedence over less timely content.
Urgent content can interrupt after the current app has had its minimum screen time. Red flashes at the edges draw attention to imminent events.
Start Autoplay from Home or by holding
Settings and setup
Apps included in the rotation
Default and maximum time per app
Minimum seconds before an urgent app may interrupt, and the interrupt threshold (0-1)
Fade between apps, in seconds (0 for a hard cut)
Idle minutes before autoplay starts on its own (0 = never)
Whether to enter autoplay automatically when the server starts
Current app priorities and display history
‹
›
×
Capabilities
Each sighting includes a photo, species name, count, time and location, with up to four species per page.
Rare sightings are labeled, with unconfirmed reports marked separately. Show them first or limit the display to rarities.
Search near the display or another location. Each species appears once, even when it has several reports.
Settings and setup
Search location: the display, a place name or a US ZIP code
Search radius in km and how many days back
Columns per page: one full-width card, or two to four per page
Time per page
Minutes between refreshes
Show photos, rarities first, or rarities only
Font
eBird API key via environment or config.yaml
Data sources
Cornell Lab eBird API Nearby sightings and rarity reports; requires an API key.Wikipedia API Species photos from Wikipedia articles.
‹
›
×
Capabilities
Browse fiction, nonfiction, audiobooks and free books, with covers and chart positions.
Open a book’s details for its author, genres, ratings and summary. Books on both charts appear as one entry.
Press
Settings and setup
Which cards run and in what order (listings, top and new per kind)
Region for Apple’s charts
Books per list
Age limit for new releases
Time per view
Minutes between refreshes
Font
NYT Books API key via environment or config.yaml
Data sources
Apple Books charts RSS Charts for paid books, free books and audiobooks.iTunes lookup and search API Book details and search results.NYT Books API Best-seller lists; requires an API key. Apple charts provide a fallback without one.
‹
›
×
Capabilities
Rotate through cameras with a slow pan and fade, or show several together.
Snapshots refresh while the app is on screen. Cameras reported offline are omitted.
These are still images, not a live video feed.
Settings and setup
Which cameras to show, or all of them
Layout: rotate full screen one at a time, or grid with all cameras at once
Snapshot refresh interval in seconds
Show or hide the camera name
Seconds per camera, fade style (cross-fade, through black, through white) and fade seconds
Ring Partner API credentials and a guided account-linking command
Diagnostics listing each camera’s status and last snapshot
Data source
Ring Partner API API Camera snapshots through a linked Ring account.
‹
›
×
Capabilities
Each vehicle shows its battery level, range, location and whether it’s charging, driving or parked.
Additional details include temperature, mileage, lock status and Sentry Mode.
Sleeping cars retain their last reading, labeled as asleep. Waking them for fresh data is optional, since doing so uses battery.
Settings and setup
Link or unlink a Tesla account
Discover vehicles and check which to show
Units: miles or kilometers
Seconds per vehicle when cards page
Poll interval in seconds
Wake sleeping vehicles for fresher data (off by default)
Home location and home radius in miles
Diagnostics: status, battery and last poll per vehicle
Data sources
Tesla Fleet API API Vehicle readings through a linked Tesla account.Tesla compositor Unofficial Vehicle images from the undocumented service used by Tesla’s configurator.
‹
›
×
Capabilities
Speak through a microphone and hear the answer through the speaker, with a transcript on the display.
Voice commands can switch apps and adjust display settings. The microphone stays open briefly after switching apps so you can follow up.
Hold
Settings and setup
Gemini Live model
Voice, or the model default
Allow interruptions while Lumi speaks, for use with a headset or echo-canceling microphone
Persona: a paragraph about the household, neighborhood, or tone of voice
How long the microphone stays open after a voice command switches apps
Idle time before the conversation goes to sleep
Type a line into the live conversation, copy or clear the transcript
Gemini API key via environment or config.yaml
Data sources
Google Gemini Live API Voice conversations and display commands; requires a Gemini API key.Microphone and speaker Device Audio input and output on the Pi, connected to the Gemini voice session.
‹
›
×
Capabilities
Show saved locations as analog or digital clocks, with sunrise, sunset and local sky colors.
The world map labels each city with its time and pans to include locations that don’t fit together.
Time zones account for daylight saving time. Sunrise and sunset are calculated locally.
Settings and setup
Locations: search a city to add, drag to reorder, and edit each title
Look: classic clocks side by side, or world map
Style: analog, digital (12-hour), or 24-hour
Show seconds (sweeping hand or seconds digits)
Font
Data sources
Local computation Local System time, time-zone data and locally calculated sunrise and sunset, with a bundled world map.Open-Meteo geocoding API Coordinates for place-name searches, without an API key.
‹
›
×
Capabilities
Browse contribution graphs by year, with totals and current and longest streaks.
An activity feed includes commits, pull requests, issues, comments and releases, along with activity from followed users and watched repositories.
Show your own account or another user’s public activity.
Settings and setup
GitHub username, or blank for the token’s own account
GitHub personal access token in the environment or config
Choose and reorder cards (heatmap, activity)
Seconds per card
Refresh interval in minutes
Display font
Diagnostics showing fetch status
Data sources
GitHub GraphQL API Contribution history; requires a personal access token.GitHub REST events API Repository and user activity, using the same token.
‹
›
×
Capabilities
Ship cards show the name, flag, heading, speed and vessel type. Aircraft cards add altitude, aircraft type and route.
A map shows the surrounding traffic, then zooms in on individual ships and planes.
Local AIS reception can be combined with an online ship feed. Aircraft positions come from an online ADS-B feed; configured alert zones identify traffic worth interrupting for.
Settings and setup
Ships, aircraft, or both
Mode: cards, map overview, or mix (alternate), plus the map style
Time per ship or aircraft, with a separate duration for alerts
Center point and radius for aircraft; minimum altitude; minimum knots for a ship to count as moving
Alert zones for ships and aircraft
Overview, closeup and mix-switch seconds, and the closeup map zoom
Refresh interval and age limit for ship and aircraft readings
Ship tracking bounds and API keys in config.yaml; feed and source health shown on the tab
Data sources
AIS-Catcher Radio Ship positions decoded from the radio and VHF antenna.aisstream.io API Optional AIS data from other receivers; requires an API key.adsb.lol API Aircraft positions from a community ADS-B network.Route and aircraft lookups Unofficial Route information from adsb.lol’s VRS data and aircraft types from adsbdb.com.Map tiles Unofficial Esri World Imagery, CARTO, OpenStreetMap or OpenTopoMap, depending on the selected style.
‹
›
×
Capabilities
See the generation mix, including how much comes from renewables, alongside power flowing to batteries or out of state.
Charts show demand and generation through the day, plus forecasts and electricity prices for the selected pricing location.
Grid alerts appear across the views, and older data is marked as stale.
Settings and setup
Which cards show (mix, today, price) and their order, with drag to reorder
Pricing node: NP15, ZP26 or SP15 hub, or the PG&E, SCE or SDG&E load area
Seconds per card
Refresh interval in minutes
Font
Diagnostics showing the latest reading, demand, renewable share and price
Data sources
CAISO Today’s Outlook Unofficial Generation, demand and grid status from the files behind CAISO’s website.CAISO OASIS API Electricity prices for the selected pricing location.
‹
›
×
Capabilities
See travel times in both directions, with congestion compared to a typical trip at that hour.
Check later departure times to see how historical traffic might affect the drive.
Nearby US border crossings show vehicle and pedestrian waits. Autoplay can prioritize drives that are taking longer than usual.
Settings and setup
Destinations by address or place name, dragged into order, each with a label and its own origin
Departure times to forecast, and how long a forecast holds before snapping back to now
Rows per page and seconds per page
Refresh minutes on screen, idle, and for forecasts, plus the daily request budget
Minutes worse than usual before joining autoplay, or always join
Border waits on or off, the radius in miles, and refresh minutes
Font
TomTom API key
Data sources
TomTom Routing API Current and forecast drive times; requires an API key. Requests are limited by a configurable daily budget.CBP Border Wait Times Unofficial Vehicle and pedestrian waits from the feed behind CBP’s website.
‹
›
×
Capabilities
Combine related stops into one board, with a countdown to the next departure and a list of those that follow.
Separate columns keep buses, trolleys and other transit modes easy to scan. Live estimates and delays are marked.
Departures approaching the warning window are highlighted. The app leaves Autoplay when there are no more departures to show.
Settings and setup
Data provider, server, and API key
Find stops around a location (with radius) or by the stop code on the sign
Cards that combine stops, with labels and optional route filters
Transit modes to show as columns: light rail, subway, rail, bus, ferry, cable, monorail
Approach warning minutes and departure horizon minutes
Seconds per card and display font
Refresh seconds on screen and refresh minutes off screen
Data sources
OneBusAway (San Diego MTS) API Live arrivals for MTS stops; requires an API key.Transitland API An alternative transit provider; requires an API key and refresh settings appropriate to its request allowance.
‹
›
×
Capabilities
Event cards include the title, time, location and description, with dates marked on a month calendar.
The list view lets you browse by event or date and open details with
Connect iCloud calendars, including accepted shared calendars, or add iCal feeds from Google Calendar and other providers.
Settings and setup
Layout: cards (one event at a time) or table (chronological list)
Seconds per event, days ahead to show, and minutes between refreshes
Which discovered Apple calendars to show
iCal feeds to add or remove, each with an optional display name
A display name and color per calendar
Font
Apple ID and app-specific password in config.yaml
Per-calendar fetch status and upcoming counts in diagnostics
Data sources
iCloud CalDAV API iCloud calendars, using an Apple ID and app-specific password.ICS feeds iCal Calendar feeds, including Google Calendar’s private iCal links.
‹
›
×
Capabilities
Browse individual fires, a regional map or a list ordered by distance, with reported containment and available incident details.
Larger fires include mapped perimeters. Optional satellite hotspots show recent detections.
An activity chart shows how hotspot detections have changed over time.
Settings and setup
Home location to center on (search a place or US zip)
Nearby radius and region radius in km
Minimum acres to show and whether to include prescribed burns
Hotspot days window for satellite detections
Optional NASA FIRMS map key for hotspots
Choose, reorder and hide cards (local, region, list, activity)
Map style, units (miles or km), seconds per view, refresh minutes and font
Diagnostics table listing each fire with containment, distance and start time
Data sources
NIFC WFIGS API Reported wildfire incidents and perimeters from the National Interagency Fire Center.NASA FIRMS API Optional satellite hotspot detections; requires a map key.Map tiles Unofficial OpenStreetMap for the background map.
‹
›
×
Capabilities
Browse trending titles and recent releases available in the selected region.
Each title includes artwork, a synopsis, ratings and streaming services. Optional OMDb data adds IMDb, Rotten Tomatoes and Metacritic scores.
Press
Settings and setup
Which cards run and in what order (movies, TV, trending, new)
Region for streaming availability, from the countries TMDB covers
Titles per list (up to TMDB’s page of 20)
Age limit for new releases
Time per view
Minutes between refreshes
Font
TMDB key (required) and OMDb key (optional) via environment or config.yaml
Data sources
TMDB API Titles, artwork and streaming availability; requires an API key. Streaming-provider data is credited to JustWatch.OMDb API Optional IMDb, Rotten Tomatoes and Metacritic ratings; requires an API key.
‹
›
×
Capabilities
Show a seven-day forecast and hourly conditions for up to eight locations.
A walkability score combines feels-like temperature, rain, wind, air quality, UV and dew point. Press
Hourly views also cover temperature, wind, UV, air quality, humidity and pressure. Animated radar joins the rotation when rain is nearby.
Settings and setup
Up to 8 locations: the display’s own, a 5-digit US zip, or a city by name
Optional label per location that overrides the place name
Drag locations into the order the display cycles through
Seconds per view
Forecast refresh minutes
Display font
Radar map style
Diagnostics per location
Data sources
Open-Meteo API Weather forecasts and air-quality data, without an API key.Zippopotam.us API Coordinates for US ZIP codes.RainViewer API Recent rain radar imagery.Map tiles Unofficial OpenTopoMap for the background map.
‹
›
×
Capabilities
Play Dr. Lumi, Snake, Breakout, Pong, Lum-Man, Hermie’s Adventure, Sudoku, Tic-Tac-Toe, Connect 4 and, yes, DOOM.
The menu shows AI-played demos. Opponent and difficulty options vary by game, with some supporting two people sharing the remote.
High scores and records are saved. Leave a game and it pauses until you return.
Settings and setup
Choose games and their order
Opponent or difficulty per game, including two-player mode for the board games
Pong’s winning score and Hermie’s maze generator
Dr. Lumi starting level and music choice
DOOM gamma and music volume
Seconds per demo card on the menu
View and reset high scores, plays and time played per game or all at once
Data sources
doomgeneric Local DOOM runs on the Pi through this portable port of Chocolate Doom, with a LumiBridge platform layer for the display, remote and sound.Freedoom Local The free game data DOOM plays by default, downloaded once at setup. An original DOOM WAD can be dropped in instead.
‹
›
×
Capabilities
Move, Exercise and Stand rings appear beside hourly activity, steps and workout details.
Several people can appear side by side, each with their own goals.
Health Auto Export sends updates from each phone. The display keeps the latest data through restarts and flags phones that haven’t reported for a day.
Settings and setup
People to include, with an ID and display name
Move goal in calories, exercise goal in minutes and stand goal in hours per person
Display font
Web-sized view of today’s rings, chart and workouts per person
Freshness indicator showing how recently each person’s phone reported
Data source
Health Auto Export Phone Apple Health data sent by an automation on each person’s phone to the display over the local network.
‹
›
×
Capabilities
Schlage WiFi and Tuya or Smart Life locks share one display, with distinct states for locked, unlocked and jammed.
Select a door with
Battery warnings flag low charge, and stale readings turn gray.
Settings and setup
Schlage account email and password
Tuya cloud project credentials, device ids and regional API base
Rename any door for the screen
Seconds per page
Refresh interval in minutes
Display font
Diagnostics table of each door’s source, state, battery and last change
Data sources
Schlage Unofficial Lock readings and commands through an unofficial client, using the account’s email and password.Tuya Cloud API Smart Life locks through Tuya’s API; requires cloud-project credentials.
‹
›
×
Capabilities
Use up to four rows, each with its own sources, colors and animation.
Headlines can scroll, slide up, appear as captions or use individual cards, with the outlet identified alongside.
Filter out older stories. In card mode, pausing can show a QR code to the article.
Settings and setup
Add, remove and reorder news rows
News sources for each row, including custom RSS feeds
Animation, text color, background color, scroll speed and seconds per page per row
QR code to the article when paused, for card rows
Font, with anti-aliased or crisp pixel text
Refresh minutes, headlines per source and maximum story age in hours
Add your own fonts by dropping files into the app’s fonts folder
Data sources
Publisher RSS and Atom feeds RSS Headlines from selected publishers and custom feed URLs.Google News RSS RSS Feeds for AP, CNN and the Desert Sun.Favicons and lead images Unofficial Outlet icons from Google’s favicon service and article images from news feeds.
‹
›
×
Capabilities
Follow markets from Polymarket, Kalshi and Manifold, with labels distinguishing real-money and play-money markets.
See a single probability or compare the leading outcomes of an event, with history charts.
Combine matching questions from different markets to compare their odds. Use
Settings and setup
Search Polymarket and Kalshi together, or paste a market link, to add a market or event
Add a whole event or just one of its outcomes as its own card
Drag the market list to set the rotation order
Tick two to four entries to merge them into one card with an optional label
Seconds per view and refresh interval in minutes
Default chart zoom
Font
Data sources
Polymarket API Market odds from the Gamma API and, where used, price history from the CLOB API.Kalshi API Market odds and available history from public API endpoints.Manifold API Market probabilities from its public API.
‹
›
×
Capabilities
Photos fill the display, panning across images that don’t fit its proportions.
Choose the order and time per image, with crossfades or transitions through black or white.
Uploads are resized for the display and kept across deployments.
Settings and setup
Upload images
Reorder images
Delete images
Seconds per image
Fade style (cross-fade, through black, through white)
Fade duration in seconds
‹
›
×
Capabilities
Seat bars show ratings from safe seats through toss-ups, with party totals and a majority marker.
Group the display by forecaster to compare chambers, or by race to compare forecasters.
Views cover Senate, House, governor and presidential races, with animated transitions between forecasts.
Settings and setup
Card layout: one forecaster per card or one race per card
Which races appear (Senate, House, Governor, President) and their order
Which forecasters to include, chosen from those found on the enabled races
Time per card and transition duration
Refresh interval in minutes
Font
Data sources
270toWin Unofficial Forecast data read from election pages; depends on their page structure.Polymarket gateway Unofficial Market data used by 270toWin’s Polymarket view.
‹
›
×
Capabilities
Maps compare state prices, with historical gas-price snapshots and the least and most expensive states.
Track gas prices by grade for selected metro areas or states, including changes and record highs.
The display can automatically select the nearest metro area.
Settings and setup
Choose and reorder cards (map, ev, metros)
Add metro areas or whole states to track, or the one nearest the display
Which grades to chart (regular, mid-grade, premium, diesel)
Seconds per card
Refresh interval in minutes
Display font
Diagnostics table of today’s prices by place
Data sources
AAA Gas Prices Unofficial Gas and EV charging prices read from AAA’s website; depends on its page structure.Open-Meteo geocoding API Coordinates for place-name searches, without an API key.
‹
›
×
Capabilities
Local views show magnitude, time, depth and distance, with markers sized by magnitude and colored by age.
Compare nearby activity with significant earthquakes worldwide, or chart activity over the selected period.
USGS tsunami messages, PAGER alerts and felt reports appear when available.
Settings and setup
Places of interest, each a searched place or US zip, or the display’s own location
Search radius, minimum magnitude and days to look back
Worldwide feed: significant quakes this month or magnitude 4.5+ this week
Which cards show (local, world, activity, list) and their order
Map style and distance units in miles or kilometers
Seconds per view and refresh interval in minutes
Font
Data sources
USGS FDSN event service API Earthquakes around saved locations.USGS summary feeds API Worldwide earthquake reports.Map tiles Unofficial OpenTopoMap for the background map.
‹
›
×
Capabilities
Follow inflation, interest rates, mortgages, unemployment, Treasury yields, gas and home prices.
Individual charts and a summary dashboard show the latest readings and changes, with ranges from one year to the full available history.
Reference lines show targets and rate ranges. Optional release dates and Fed-decision market odds add context to what’s coming next.
Settings and setup
Which indicators show and their order, with gas and home prices off by default
Starting chart range
Seconds per card and refresh interval in minutes
Font
Toggle the next Fed meeting’s odds on the fed funds card
Optional FRED API key so monthly indicators show their next release date
Data sources
FRED graph CSV Unofficial Historical economic data from the St. Louis Fed’s chart exports.FRED API API Optional release dates; requires an API key.Kalshi API Market odds and available history from public API endpoints.
‹
›
×
Capabilities
Follow selected MLB teams, with recent and upcoming games and live play-by-play.
Live views include pitcher and batter photos, along with game-win odds when a Polymarket market is available.
Division standings provide context beyond the current game.
Coming soon: Scores for additional sports
Settings and setup
Up to 12 MLB teams to follow, dragged into the order they cycle
Hours before and after now that define the recent and upcoming game window
Seconds per card
Refresh minutes, live refresh seconds and standings refresh minutes
Show or hide division standings
Font
Diagnostics for each feed with status, size and last fetch
Data sources
MLB Stats API API Schedules, scores, standings and play-by-play from MLB’s undocumented API.MLB headshots Unofficial Pitcher and batter photos from MLB.Polymarket API Market odds from the Gamma API and, where used, price history from the CLOB API.
‹
›
×
Capabilities
Use
Set brightness, speaker volume and microphone gain, plus the default font and map style used by apps.
Audio device selections and volume are saved for the next startup.
Settings and setup
Brightness, volume and mic gain sliders
Speaker and microphone, which can be different devices
Volume control backend: automatic, macOS or ALSA
ALSA mixer control, automatic or a specific one
System default font
System default map style
‹
›
×
Capabilities
An ISS map shows its position and ground track, with altitude, speed and upcoming passes for the selected location.
During a pass, the display shows its direction and elevation. Predictions indicate whether a pass should be visible.
A sky view includes planets, the Moon, bright stars and constellations. ISS positions are calculated locally from saved orbital data.
Settings and setup
Observer location, defaulting to the display’s own
Mode: ISS, Sky or Mix
Seconds per view and font
Map style for the ISS map
Minimum pass elevation, so horizon-hugging passes are skipped
Constellations on or off, sky field of view and starting azimuth
A list of upcoming ISS passes with local times
Data sources
Where The ISS At API Orbital data used to calculate ISS positions and passes locally.CelesTrak Unofficial A fallback source for ISS orbital data.Map tiles Unofficial Esri World Imagery for the world map.
‹
›
×
Capabilities
Gauges show CPU load, temperature, memory, disk use and network traffic.
Ping charts track latency and packet loss for selected hosts, with history from five minutes to 24 hours.
A network view lists discovered devices. History builds while the app runs, including outages overnight.
Settings and setup
Which of the three cards show and in what order, with drag to reorder
Ping targets as host or IP plus a label, with Cloudflare, Google, HackerNews and the BBC preset
Seconds per card and the default ping history window
Ping interval and how many minutes of history to keep
Device discovery interval and age limit for saved readings
Full-scale Mbps for the network gauge and the temperature gauge’s min and max
Font, plus a diagnostics table of per-target latency, loss and the devices last seen
Data sources
The Pi itself Local CPU, temperature, memory, disk and network readings through psutil.Ping Device Latency and packet-loss measurements for selected hosts.LAN scan Device Local device discovery using the network neighbor table and name lookups.
‹
›
×
Capabilities
Browse saved stocks and indices, with price changes and highs and lows over the selected period.
Use
The heatmap sizes companies by market cap and colors them by price change.
Settings and setup
Up to 12 symbols, typed as a ticker or company name and picked from search suggestions
View: cards, heatmap, or both (heatmap first, then the cards)
Default time range the cards open on
Seconds per view
Refresh minutes while the market is open
Display font
Fetch diagnostics: request counts, failures, rate limits, and per-range data recency
Data sources
Yahoo Finance Unofficial Historical prices from Yahoo’s undocumented chart service.Yahoo quote Unofficial Market capitalization for the heatmap, also from an undocumented service.
‹
›
×
Capabilities
Flight rows show the airline, destination or origin, gate, time and status. Delays and cancellations are highlighted.
Arrivals can include baggage claim information. A separate security board shows TSA waits and PreCheck status.
Choose which boards and airlines appear. The current data source is San Diego International Airport.
Settings and setup
Airport (provider) picker
Which boards to show and in what order: departures, arrivals, security
Limit to specific airlines by two-letter code
Hours ahead to include and minutes to keep departed/landed flights
Seconds per board
Refresh rate on screen (seconds) and off screen (minutes)
Flip animation on or off
Display font
Data sources
San Diego airport flight board Unofficial The feed behind San Diego International Airport’s arrivals and departures widget; undocumented and subject to change.TakeoffTimer Unofficial TSA wait estimates from its widget feed.
‹
›
×
Capabilities
Nest and Cielo thermostats appear together, with current and target temperatures, humidity and operating mode.
Use
The display reflects the adjustment immediately, then checks it against the next reading.
Settings and setup
Link or unlink a Nest account and a Cielo account
Discover thermostats, then check which to show and drag them into order
Rename each thermostat for the display
Units: Fahrenheit or Celsius
Temperature step per remote press
Poll interval in seconds
Gauge minimum and maximum temperature
Diagnostics: mode, ambient, setpoint, humidity and last poll per thermostat
Data sources
Google Nest API Thermostat readings and controls through Google’s Smart Device Management API; requires a Device Access project.Cielo Unofficial Thermostat readings and controls through an unofficial account integration.
‹
›
×
Capabilities
A labeled grid shows each panel’s logical position, making mapping mistakes easier to spot.
A brightness ramp helps reveal uneven response or clipping.
Other views show the remote controls and replay the startup animation with sound.
Settings and setup
Panel layout and chain mapping in config.yaml, which these cards verify
Display driver, frame rate and brightness schedule in config.yaml
Open from Home or the web interface; excluded from Autoplay
‹
›
×
Capabilities
Browse Ticketmaster events by date, with artwork, venue and event details.
Combine several locations, each with its own search radius, and choose how far ahead to look.
Press
Settings and setup
Add, label and remove Ticketmaster locations (address, city or US zip)
Search radius in miles for each location
Days ahead to look for events
Seconds per event
Refresh interval in minutes
Display font
Toggle the QR code to the ticket page when paused
Diagnostics table showing each location’s fetch status
Data source
Ticketmaster Discovery API Events near saved locations; requires an API key.
‹
›
×
Capabilities
Add items on the display, then use the remote to set times, reset or remove them, and change their colors.
Timers keep running and alarms remain set when another app is showing. Finished timers and alarms flash until cleared.
Settings and setup
Display font (config.yaml)
Include in or leave out of the autoplay rotation
Position in the launcher grid
Alarms, timers and stopwatches themselves are created on the display with the remote
‹
›
×
Capabilities
Browse Apple’s album, song and podcast charts, with artwork, chart positions and available release details.
New chart entries are marked. Optional Last.fm data adds listener counts, tags and summaries.
Press
Settings and setup
Choose and reorder cards for albums, songs and podcasts
Region whose Apple Music and Apple Podcasts charts are shown
Items per card
Age limit for new releases
Seconds per item
Refresh interval in minutes
Display font
Optional Last.fm key for popularity details
Data sources
Apple Music and Podcasts charts RSS Album, song and podcast charts from Apple’s feeds.iTunes lookup API Track counts, labels and runtimes.Deezer API Additional music details when unavailable from iTunes.Last.fm API Optional listener counts, tags and summaries; requires an API key.
‹
›
×
Capabilities
See recent active users, longer-term trends, top pages and traffic sources.
Each site gets its own set of views. Use
Connect GA4 properties using a service account with Viewer access.
Settings and setup
Upload or paste the service account key, and see the email to grant Viewer access in GA4
Properties to show, each a GA4 property ID and label, up to 12
Which cards run and in what order (realtime, trend, pages, sources)
Opening horizon: today, yesterday, 7 days, 30 days or a year
Time per card
Seconds between realtime refreshes
Font
Data source
Google Analytics Data API API GA4 reports using a service account with Viewer access to each property.
‹
›
×
Capabilities
For each saved spot, see tide predictions and swell forecasts on a shared time axis.
High and low tides are labeled with times and heights, alongside water temperature and available water-quality grades and advisories.
Sunrise, sunset and Moon phase add context, with wind direction and wave period on the swell view.
Settings and setup
Up to 8 coastline spots: the display’s own location or a beach/city by name
Optional label per spot that overrides the place name on the display
Drag spots into the order the display cycles through
Seconds per view
Refresh minutes
Display font
Diagnostics: tide station, water-quality grade and last fetch per spot
Data sources
NOAA Tides and Currents API Tide predictions and water temperature from nearby stations.Open-Meteo Marine API Swell, wave period and wind for saved locations.Heal the Bay Unofficial Beach water-quality grades from the feed behind the Beach Report Card map.
‹
›
×
Capabilities
Browse the featured article, On This Day and Did You Know, with random articles mixed in.
Each card includes an image when available and introductory text. Press
Unseen daily items come first; Autoplay skips the app once its daily items have been shown.
Settings and setup
Toggle the featured article, On this day, and Did you know sections
Frequency of random articles (0 disables them)
Which language Wikipedia to read
Seconds per article
Display font
Diagnostics: today’s items, their images, and which have been shown
Data source
Wikimedia REST API Daily Wikipedia features and random article summaries.
Remote control
I use an ordinary 2.4 GHz media remote for everyday control. The buttons follow a common pattern across apps, with a few shortcuts for Home, Autoplay and voice chat.
Display on / off Turns the display off or returns to the app that was showing.
Home screen Hold: autoplay Returns to Home from any app; press again for the first page. Hold to start Autoplay.
Next / prev card Usually moves between cards or pages. Some apps use these buttons to adjust a selected value, such as a thermostat’s target temperature.
Scroll / zoom Changes the selection or view within an app, such as a chart’s time range or the selected thermostat.
Confirm Hold on Home: move an icon Opens an app or confirms an action. On Home, hold OK and use the arrows to move an icon.
Cancel / close Closes the current view or returns to the first card. On Home, switches between icons and the live dashboard.
Pause display Hold: ask by voice Pauses the display, indicated by a glow at the edges. On Home, adds or removes an app from Autoplay. Hold to open Chats.
Adjust setting Volume by default Opens Settings and adjusts the last-used control. Use left/right to select another setting and BACK to return to the app.
Schematics
These diagrams show the frame dimensions, panel layout, and connections for power, data and the Pi’s peripherals.
The display: seven P3 panels edge to edge inside a custom-ordered wooden frame.
Back side: power
The 5 V supply (heaviest part) is in the middle, driving 7 panels through four 15 A runs protected with fuses. The Pi is on one side. Its USB-C brick and the power supply's cord plug into a single flat-plug extension cord.
1 2 3 4 5 6 7
MeanWell LRS-350-5 5 V · 300 W
Fuse block 4 × 15 A
Raspberry Pi 4 Triple matrix bonnet
USB-C, 5.1 V
single extension cord
5 V, four fused runs at 15 A 120 V mains
The 5 V supply (heaviest part) is in the middle, driving 7 panels through four 15 A runs protected with fuses. The Pi is on one side. Its USB-C brick and the power supply's cord plug into a single flat-plug extension cord.
Back side: data
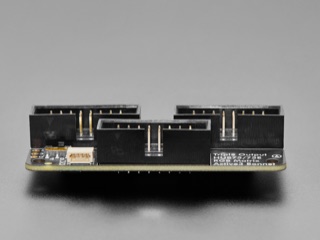
Three HUB75 chains from the triple bonnet. Each ribbon runs up the left margin and along the rail to the chain’s first panel, the one nearest the Pi, and short ribbons daisy-chain from there away from the Pi: 7 to 6, 5 to 4, and 3 to 2 to 1.
1 2 3 4 5 6 7
Raspberry Pi 4 Triple matrix bonnet three HUB75 outputs
chain: 7 → 6 chain: 5 → 4 chain: 3 → 2 → 1
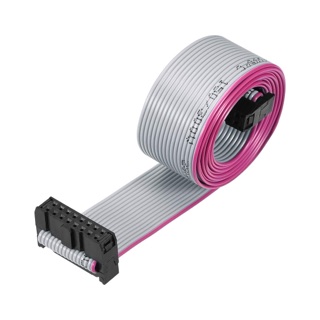
One 16-pin ribbon per chain from the bonnet to the chain’s first panel, the one nearest the Pi,
then short ribbons daisy-chain away from it, HUB75 out to HUB75 in.
Chains of 2, 2 and 3: panels 7–6, 5–4, and 3–2–1.
HUB75 ribbon, data
Three HUB75 chains from the triple bonnet. Each ribbon runs up the left margin and along the rail to the chain’s first panel, the one nearest the Pi, and short ribbons daisy-chain from there away from the Pi: 7 to 6, 5 to 4, and 3 to 2 to 1.
Back side: compute
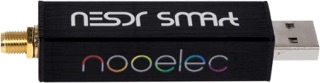
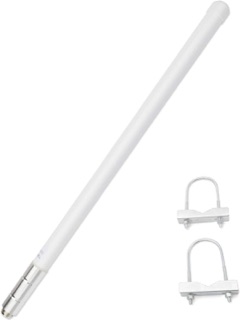
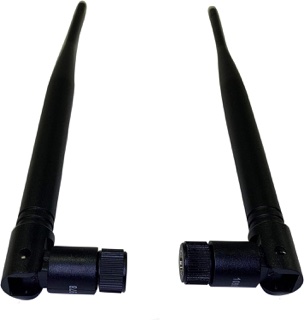
The Pi at the far left with what hangs off it: the USB sound card with its speakers and microphone, and the remote’s 2.4 GHz receiver. The software-defined radio and its VHF antenna sit outside the frame on a USB extension, away from the LEDs’ interference. The antenna decides what the radio hears: this VHF whip for ships by AIS, or an ADS-B antenna at 1090 MHz for aircraft instead, on the same dongle; a second dongle would hear both.
1 2 3 4 5 6 7
Raspberry Pi 4 1 GB · 64 GB microSD Triple matrix bonnet
USB-C brick, 5.1 V
USB sound card speaker out · mic in
2.4 GHz receiver for the remote
Speaker
Speaker
voice
Remote
2.4 GHz
USB 3.0 extension, 3 m, out through the frame
Outside the frame,
clear of the LEDs
ships · AIS, 162 MHz
VHF antenna, 136–174 MHz
Nooelec RTL-SDR v5 100 kHz–1.75 GHz
or an ADS-B antenna, 1090 MHz,
for aircraft instead of ships
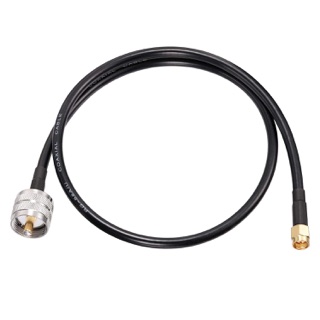
USB coax, SMA to PL-259 speaker wire over the air
The Pi connects to the USB audio hardware and the remote’s receiver. A USB extension places the radio and VHF antenna outside the frame, away from LED interference. This setup receives ship broadcasts locally and gets aircraft positions online.
Bill of materials
Here are the parts I used, with their purchase prices in mid-2026. Honestly the build turned out to be much more expensive than I anticipated,
but I like to tell myself it was overbuilt for quality and safety!
Power
MeanWell LRS-350-5 power supply, 5 V 300 W Amazon · Powers the panels.$38.99
6-way fuse block with LED indicators Amazon · Geloo.$11.59
12 AWG two-conductor copper wire, 10 ft Amazon $17.99
18 AWG wire, 40 ft Amazon · Energeaster.$8.99
Ferrule crimping tool kit, 1,400 ferrules Amazon · HSC8 6-6A ratcheting crimper, 23–10 AWG.$13.99
Insulated crimp terminal assortment, 150 pieces Amazon · Spade, ring, fork, bullet and butt connectors.$5.99
Flat-plug extension cord, 3 outlets, 6 ft Amazon · 16 AWG, 13 A, low profile.$9.99 Power subtotal $107.53
Frame and mounting
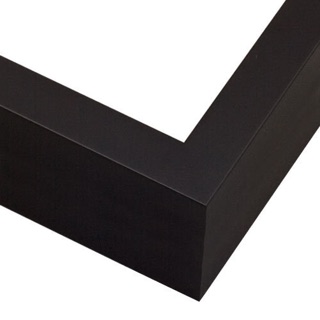
Spiro satin black custom picture frame, 55 × 10 in Pictureframes.com · Deep black wood, SKU SP2. Image size 53¼ × 8¼ in, no acrylic or backing. $136.48 on sale from $227.46; total as paid, including shipping and tax.$172.06
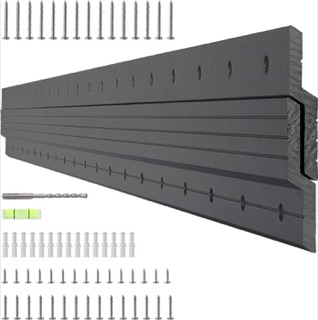
French cleat hanger, 41 in aluminum Amazon · Rated to 250 lb.$39.99
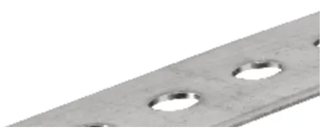
SteelWorks slotted steel flat bar, 0.074 × 1.38 × 72 in ×2 Ace Hardware · Item 53689. Cut to length for the two rails the panels bolt to, top and bottom, inside the frame.$47.98 $23.99 each
Right-angle L brackets, 20 pieces Amazon · 1.5 × 1 × 0.5 in, black.$6.99
Metric hex socket screw assortment, 888 pieces Amazon · M2 to M4, with nuts and washers.$8.99
Nylon zip ties, 400 pieces, assorted Amazon · 4, 6, 8 and 12 inch.$6.99 Frame and mounting subtotal $283.00
Total
$793.13




 ▲▼◀▶
▲▼◀▶




 Next / prev card
 Scroll / zoom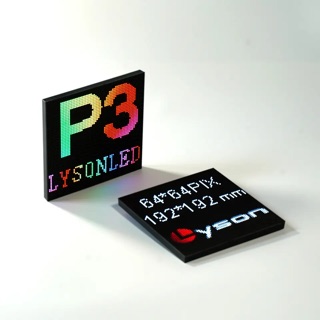
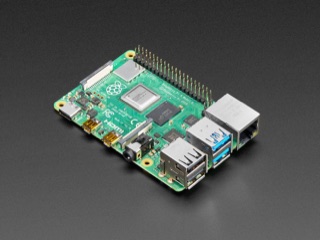 Raspberry Pi 4 Model B, 1 GB
$38.50
Raspberry Pi 4 Model B, 1 GB
$38.50
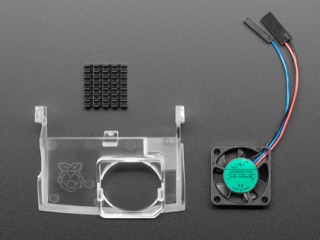 Official Raspberry Pi 4 case fan and heatsink
$7.25
Official Raspberry Pi 4 case fan and heatsink
$7.25
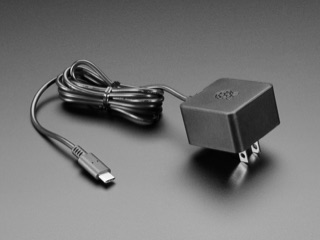 Official Raspberry Pi power supply, 5.1 V 3 A USB-C
$8.74
Official Raspberry Pi power supply, 5.1 V 3 A USB-C
$8.74
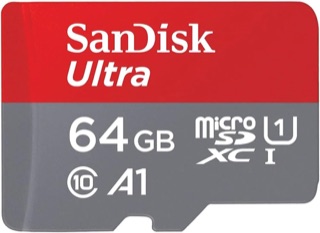 SanDisk Ultra microSD, 64 GB
$22.71
SanDisk Ultra microSD, 64 GB
$22.71
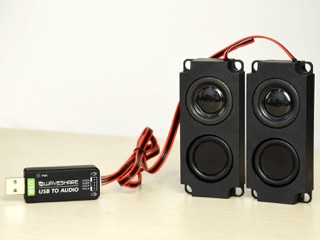 USB sound card with 8 Ω 5 W speaker
$18.99
USB sound card with 8 Ω 5 W speaker
$18.99
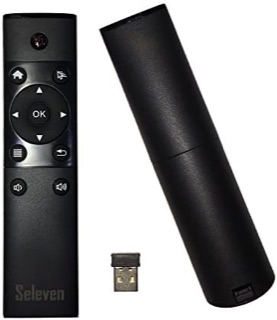 2.4 GHz USB wireless remote control
$12.96
2.4 GHz USB wireless remote control
$12.96
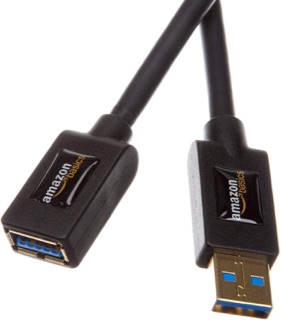 Amazon Basics USB 3.0 extension cable, 3 m
$7.92
Amazon Basics USB 3.0 extension cable, 3 m
$7.92
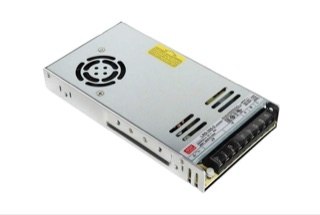 MeanWell LRS-350-5 power supply, 5 V 300 W
$38.99
MeanWell LRS-350-5 power supply, 5 V 300 W
$38.99
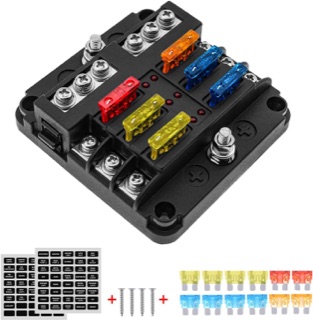 6-way fuse block with LED indicators
$11.59
6-way fuse block with LED indicators
$11.59
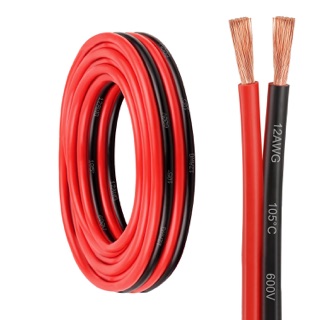 12 AWG two-conductor copper wire, 10 ft
$17.99
12 AWG two-conductor copper wire, 10 ft
$17.99
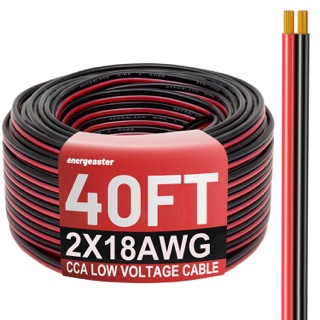 18 AWG wire, 40 ft
$8.99
18 AWG wire, 40 ft
$8.99
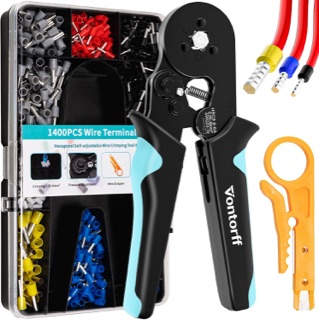 Ferrule crimping tool kit, 1,400 ferrules
$13.99
Ferrule crimping tool kit, 1,400 ferrules
$13.99
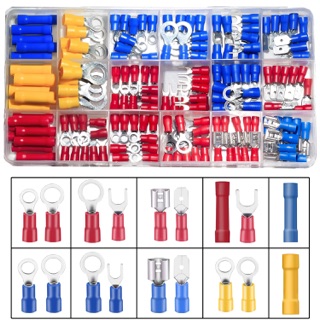 Insulated crimp terminal assortment, 150 pieces
$5.99
Insulated crimp terminal assortment, 150 pieces
$5.99
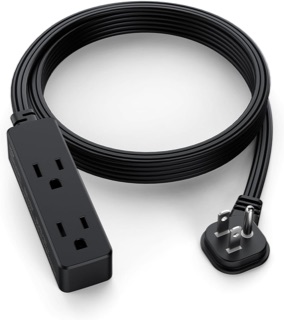 Flat-plug extension cord, 3 outlets, 6 ft
$9.99
Flat-plug extension cord, 3 outlets, 6 ft
$9.99
 Spiro satin black custom picture frame, 55 × 10 in
$172.06
Spiro satin black custom picture frame, 55 × 10 in
$172.06
 French cleat hanger, 41 in aluminum
$39.99
French cleat hanger, 41 in aluminum
$39.99
 SteelWorks slotted steel flat bar, 0.074 × 1.38 × 72 in×2
$47.98$23.99 each
SteelWorks slotted steel flat bar, 0.074 × 1.38 × 72 in×2
$47.98$23.99 each
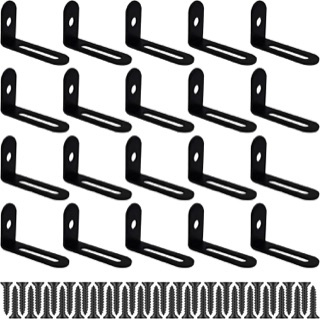 Right-angle L brackets, 20 pieces
$6.99
Right-angle L brackets, 20 pieces
$6.99
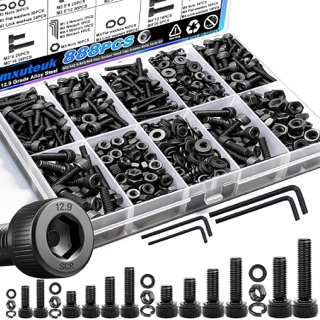 Metric hex socket screw assortment, 888 pieces
$8.99
Metric hex socket screw assortment, 888 pieces
$8.99
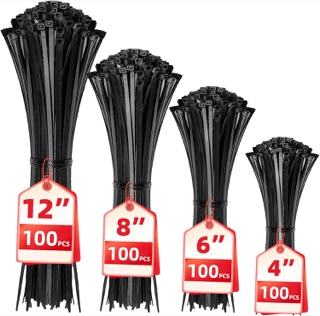 Nylon zip ties, 400 pieces, assorted
$6.99
Nylon zip ties, 400 pieces, assorted
$6.99